Preference mapping
1 refers to as a group of multivariate statistical techniques designed to develop a deeper understanding of consumer liking of goods. Results of such analyzes can be for example used to assist the product developer in selecting out of a set of prototypes, the product which may maximize consumer liking.
There has been very good descriptions in the literature of the original algorithm (MDPREF)
2. Among these is that of Greenhoff and MacFie (1999)
3 which gives a comprehensive review of both internal and external mapping.
Internal preference mapping derives a multidimensional representation of products and consumers. This representation is obtained through singular value decomposition (i.e. Principle Component Analysis,
PCA) of a data matrix with products as rows and consumers as columns. For a given consumer, the data used is a hedonic score on a set of products. The Principal components evaluated are usually referred to as preference dimensions
3.
Data pretreatment includes mean centering for each consumer and often scaling of individuals to unit variance (i.e. normalizing)
3. However, some prefer not to normalize each consumer since consumers that discriminate among products and those that do not are in the case of normalized data treated equally. The practice of standardizing results in treating all consumers equal with respect to their discrimination of the products and is equivalent to performing the principal component analysis on the correlation matrix. From a theoretical standpoint, consumers with small variance do not necessarily express a preference for any of the products and maybe should not be given the same weight as a consumer expressing a like for some products and a dislike for others. If one agrees with this premise the analysis should be performed on the covariance matrix (i.e. mean centered data). Whether or not this makes a significant difference and changes the interpretation of the results is debatable.
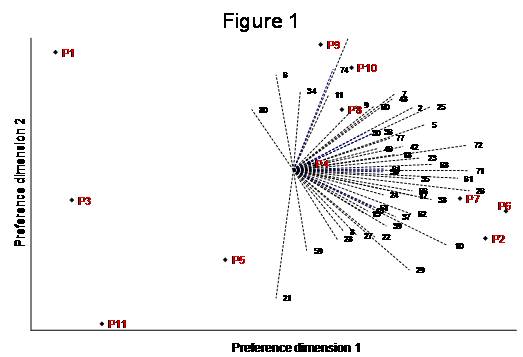
Internal preference maps are easy to interpret. The direction of each vector represents the direction of increasing liking for each individual consumer. It is considered to only be an approximation since only two dimensions are being considered. The length of the vector is directly proportional to the amount of variance explained by the first two preference dimensions for each consumer.
Internal Preference mapping is used by marketer to assess consumer segmentation. Below are two figures showing an example with little segmentation (Fig 1.) and another with clear segments (Fig. 2).
References
1 Carroll, J.D. 1972. Individual differences and multidimensional scaling. In R.N. Shepard, A.K. Romney, and S.B. Nerlove (Eds) Multidimensional scaling: theory and applications in the behavioral sciences, Volume 1 (pp. 105-155). New York: Seminar Press.
2 Chang, J.J. and Carroll, J.D. 1968. How to use MDPREF, a computer program for multidimensional analysis of preference data. Unpublished report, Bell Telephone Laboratories.
3 Greenhoff, K. and H.J.H. MacFie.1999. Preference Mapping in practice. In Measurement of food preferences. Editors: H.J.H. MacFie and D.M.H. Thomson. Aspen Publishers, Inc. Gaithersburg, Maryland.