Penalty analysis (PA) has been used extensively by practitioners in the industry to assist in identifying decreases in acceptability associated with sensory attributes not at optimal levels in a product. The scales used to acquire the data are known as
Just About Right Scales. In addition, liking data needs to be collected. For the latter,
The 9-point Hedonic Scale is frequently used. PA provides a prioritized list of critical product characteristics that are most-penalizing product performance. It can be a graphical technique to reveal the possible penalty paid by the product in terms of reduced overall liking for not being “just about right” on a characteristic and the penalty is often called mean drop on overall liking.
The procedure for PA is summarized as follows:
PA is usually a product specific analysis. Consumer are first grouped in one of three groups depending on the response given to a JAR attribute (i.e. Too little, JAR or Too much). The percentage of consumers in each of the 3 categories is calculated and corresponding mean liking (
L TL ,
L JAR,
L TM) scores for the “Too Little” (TL), “JAR” and “Too Much” ™ categories estimated. Penalties are calculated as follows:
Penalty
TL =
L JAR –
L TL
Penalty
TM =
L JAR –
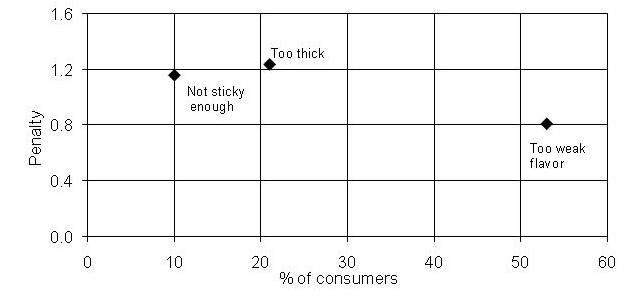
L TMResults are most often represented graphically by plotting the penalty or mean drops against the percentage of consumers for all the JAR scale attributes of the product. A penalty is usually not computed if the % of consumers in the TL or TM categories is less than 20%. Some users also calculate what is known as the net penalty. The net penalty is obtained by multiplying the TL or TM mean drop by the proportion (not the percentage) of consumers who scored the attribute TL or TM. An example of a penalty analysis graph is provided below. In addition, the significance of the penalties can be tested by performing a simple t-test comparing the liking scores from consumers in the TL or TM category to those of consumers in the JAR category.